
Your WooCommerce store made $5,000 in sales last week. That sounds like good news. But is your business actually growing?
Maybe you received more orders but sold mostly discounted products. Perhaps one bestselling product generated most of your revenue, while several other products barely moved. Or maybe sales increased while refunds and operating costs quietly reduced your margins.
Revenue alone cannot answer every business question. You need to understand order volume, average order value, product performance, refunds, and changes over time.
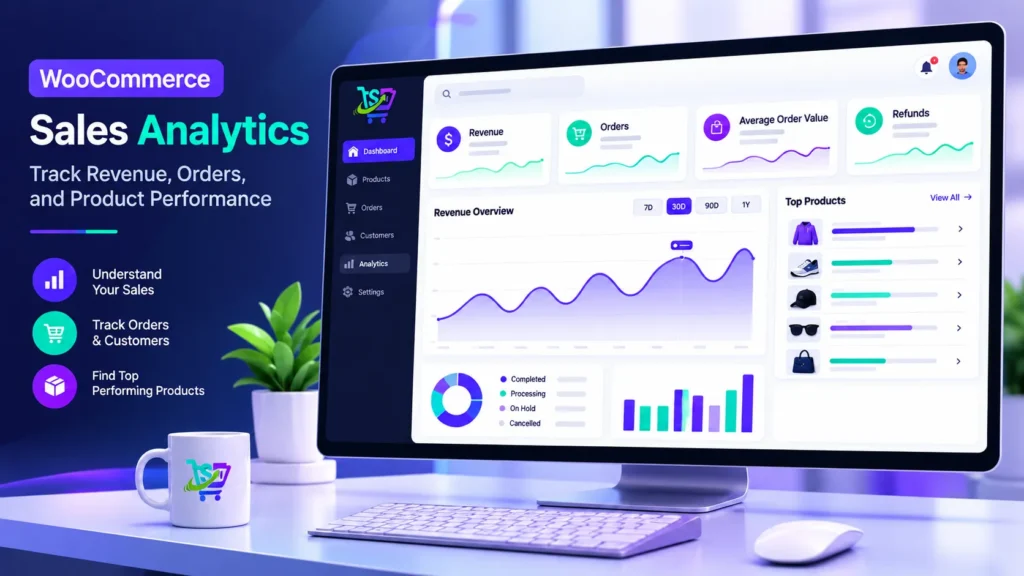
A WooCommerce sales analytics dashboard helps turn your store’s sales records into information you can use to make better decisions. In this guide, we will explain the essential metrics, show you how to analyze your store, compare analytics tools, and explore how Shop Explorer by WPAzleen brings sales insights into your WordPress dashboard.
Table of Contents
- What is WooCommerce sales analytics?
- Why sales analytics matters
- Key WooCommerce sales metrics
- How to track sales in WooCommerce
- How to analyze product performance
- How to identify sales trends
- Revenue vs profit: Understand the difference
- WooCommerce analytics with Shop Explorer
- Shop Explorer vs other analytics tools
- Common analytics mistakes
- Frequently asked questions
What Is WooCommerce Sales Analytics?
WooCommerce sales analytics is the process of examining sales and order data to understand how your store is performing.
Instead of looking only at individual orders, analytics brings important information together into metrics, reports, charts, and comparisons. These views help you identify patterns that may not be obvious when reviewing orders one by one.
A typical WooCommerce sales analytics dashboard may help you answer questions such as:
- How much revenue did the store generate during a selected period?
- How many orders were placed?
- What is the average value of an order?
- Which products generate the most sales?
- Are sales increasing or decreasing over time?
- How much revenue is being returned through refunds?
- Which products or customer groups deserve closer attention?
WooCommerce includes its own analytics reports, including reports for products, orders, revenue, and other store activity. Dedicated analytics plugins can provide additional reporting interfaces and analysis workflows.
Why Sales Analytics Matters for Your WooCommerce Store
Make decisions using actual store data
It is easy to assume that a product is performing well because it receives attention or sells frequently. Sales reports help you examine revenue, order volume, and product performance before deciding where to invest your time and budget.
Understand changes in sales
A sudden increase in orders might come from a promotion, a seasonal event, or a popular product. A decline might be related to reduced demand, stock availability, or changes in your marketing activity. Analytics helps you investigate these possibilities rather than relying on guesses.
Identify your strongest products
Product performance reports can help you find products that contribute significantly to sales. You can then investigate their stock levels, pricing, customer demand, and opportunities for complementary products.
Recognize problems earlier
Monitoring order volume, refunds, and revenue trends can help you notice unusual changes. These metrics do not automatically reveal the cause, but they can tell you where further investigation is worthwhile.
Key WooCommerce Sales Metrics You Should Track
You do not need dozens of charts to understand your store. Start with a small set of useful metrics, then add more detailed reports when you need to answer a specific business question.
| Metric | What it tells you | Question to ask |
|---|---|---|
| Gross revenue | Sales value before applicable deductions under the report’s definition | How much sales value did the store generate? |
| Net sales | Sales after the deductions included in the report’s calculation | How much sales value remains after discounts and returns included in the calculation? |
| Order count | Number of orders recorded in the selected period | Are more or fewer orders being placed? |
| Average order value | Average value per order under the selected calculation | How much does a typical order contribute? |
| Product sales | Sales performance of individual products | Which products contribute most to sales? |
| Refunds | Value of returned payments or sales included in the report | Are refunds increasing or concentrated in certain products? |
| Shipping and tax | Amounts associated with shipping and tax | How do these amounts affect the total collected and reported? |
Important: Reporting tools may define gross revenue, net sales, total sales, and average order value differently. Always read the metric definitions in the tool you use before comparing figures across reports.
Understand average order value
Average order value, commonly called AOV, estimates the average amount associated with each order under a particular reporting definition.
For a simple example, suppose your store records $2,400 in sales across 60 orders during a selected period. If those figures use the same sales definition, the average is $40 per order.
This metric can help you evaluate product bundles, cross selling, free shipping thresholds, and other strategies designed to encourage larger purchases. However, a higher AOV does not automatically mean higher profit.
How to Track Sales in WooCommerce Step by Step
You can start with WooCommerce’s built in analytics or use a dedicated dashboard that presents your preferred metrics in one place. The right option depends on how much reporting detail you need and how you prefer to work.
Step 1: Open your analytics dashboard
In your WordPress dashboard, open the WooCommerce Analytics area to explore the available reports. If you use Shop Explorer, open its settings and enable the WooCommerce Analytics Dashboard option where available.
In Shop Explorer, navigate to Settings > WooCommerce, switch on the WooCommerce Analytics Dashboard setting, and save your settings. The analytics route can then be opened from the available dashboard navigation.
Step 2: Select the reporting period
Choose the date range that matches your question. A short period can help investigate a recent change, while a longer period may reveal seasonality or sustained growth.
Available date ranges vary by reporting tool and edition. Check the date controls available in your installation before planning comparisons.
Step 3: Review the main metrics
Start with revenue, order count, average order value, and refunds where available. These metrics provide an initial view of sales activity and help you decide which report to examine next.
Step 4: Inspect the sales charts
Look for changes in daily sales, order volume, and average order value. A chart can help you see when a change occurred, but you may need to examine individual orders, products, promotions, or other business information to understand why.
Step 5: Investigate the product reports
Review which products are selling, which generate the most sales value, and which have experienced a change in demand. If a product’s performance shifts unexpectedly, check its stock, price, discounts, and order history.
Step 6: Record your findings and actions
Do not stop at viewing the dashboard. Write down what changed, what you think may have caused it, what evidence supports that explanation, and what you will test next.
How to Analyze WooCommerce Product Performance
Not every popular product contributes to your business in the same way. One item might sell many units at a low price, while another sells fewer units but generates more revenue per order.
Compare products by sales value and units sold
Use a product report to review metrics such as items sold, net sales, order count, and stock status where available. WooCommerce’s Products Report, for example, supports product level views and comparisons over a chosen reporting period.
Consider this illustrative example. These values are fictional and demonstrate how to interpret a report, not actual Shop Explorer customer data.
| Product | Units sold | Illustrative sales value | What to investigate |
|---|---|---|---|
| Wireless headphones | 120 | $3,600 | Demand, stock, and product bundles |
| Smart watch | 45 | $4,050 | Price positioning and customer demand |
| Phone case | 200 | $2,000 | Cross selling and order contribution |
The phone case sells the most units in this example, but the smart watch generates the highest sales value. This is why looking at only one metric can lead to incomplete conclusions.
Investigate products with declining sales
If a product’s sales decrease, first check whether it was available throughout the period. Then review its price, discounts, product page, recent orders, and any marketing changes that could be relevant.
Use product insights to plan inventory
Product sales reports can help you identify items that may need closer inventory attention. Combine sales trends with current stock levels and supplier lead times before deciding how much inventory to reorder.
How to Identify WooCommerce Sales Trends
A single day’s sales rarely tells the whole story. Trends become more meaningful when you examine a consistent reporting period and compare it with a suitable baseline.
Compare equivalent periods
Compare equivalent days or weeks when possible. For example, compare one complete week with the previous complete week rather than comparing a full week with only two days of data.
Separate order growth from order value
If revenue rises, investigate whether the change came from more orders, higher average order value, price changes, or a different product mix. These causes can require different business responses.
Look for seasonal patterns
Many stores experience demand changes around holidays, promotions, weather, or industry events. When enough historical data is available, compare similar seasonal periods rather than assuming that every increase or decline reflects a long term trend.
Investigate unexpected changes
A chart identifies what changed, not necessarily why. Review the underlying orders and consider stock availability, discounts, marketing campaigns, payment problems, and refunds before settling on an explanation.
Revenue vs Profit: Understand the Difference
Revenue measures sales activity under a reporting definition. Profitability considers the costs associated with generating those sales. The two are related, but they are not interchangeable.
For example, a store may increase sales by offering a large discount. Order volume might rise, but product costs, payment fees, shipping expenses, refunds, and advertising costs can reduce the amount the business retains.
| Business measure | What to examine |
|---|---|
| Sales revenue | Sales recorded during the reporting period |
| Discounts and refunds | Reductions included in the relevant sales calculation |
| Cost of goods sold | What the sold products cost the business |
| Shipping and transaction costs | Expenses associated with fulfillment and payment processing |
| Operating expenses | Other business costs such as advertising, software, and overhead |
To understand profitability, you need reliable cost information in addition to sales metrics. Confirm which costs your reporting tool includes before treating any displayed margin as final business profit.
Shop Explorer provides sales analytics and includes product cost tracking capabilities. These can help bring sales and cost information into your store management workflow, but the accuracy of any profit estimate depends on the quality and completeness of your cost data.
WooCommerce Sales Analytics With Shop Explorer
Shop Explorer by WPAzleen combines WooCommerce store management tools with an analytics dashboard inside the WordPress admin experience. Its published features include revenue charts, sales metrics, order information, and product performance insights.
View revenue and sales activity
The analytics dashboard presents sales information through interactive charts and metrics. According to the published feature documentation, the analytics workflow includes revenue, order activity, average order values, taxes, shipping revenue, and margin related calculations.
Understand performance through charts
Visualizing revenue alongside order counts can help you spot changes in sales activity. Shop Explorer’s analytics dashboard includes interactive charts designed to make those patterns easier to examine.
Connect insights to store operations
When a product attracts attention, you may need to adjust its inventory. When order volume changes, you may need to review fulfillment capacity. Having product, order, customer, and analytics tools within the same store management plugin can make these follow up tasks easier to coordinate.
Explore AI assisted revenue analysis
Shop Explorer’s feature documentation also describes an AI revenue analysis workflow that uses store metrics to answer questions about sales trends and product performance. Availability of advanced analytics and AI capabilities can depend on the installed version and plan, so verify the current feature settings before relying on them.
AI generated explanations should be treated as analysis to review, not proof of a cause. Validate suggestions against the underlying orders, refunds, costs, and reporting period before making business decisions.
Shop Explorer vs WooCommerce Analytics vs Metorik
There is no single analytics tool that fits every store. Your choice depends on whether you need basic sales reporting, integrated store management, or deeper reporting and segmentation.
| Capability | Shop Explorer | WooCommerce Analytics | Metorik |
|---|---|---|---|
| Where you work | Inside the WordPress admin dashboard | Inside WooCommerce in WordPress | Connected external analytics service |
| Sales and order reporting | Revenue charts and store metrics | Built in analytics reports | Broad sales and order reporting |
| Product performance | Store analytics and product management workflow | Dedicated Products Report with product comparisons | Dedicated product reports and filtering |
| Customer analysis | Customer management and store metrics | Customer related reports available | Customer segments, lifetime value, and cohort reporting |
| Profit analysis | Cost tracking and margin related features documented | Depends on available reports and additional tools | Cost and profit reporting capabilities |
| Other store management tools | Product editing, orders, customers, invoices, and more | Core WooCommerce administration and reporting | Analytics, reporting, and connected ecommerce workflows |
| Cost model | Published core feature set is free | Included with WooCommerce | Paid subscription with order volume based pricing and trial |
Comparison note: This table summarizes each tool’s main positioning, not every available feature. Check the official documentation and current plan information for the exact capabilities you need.
Choose Shop Explorer if you want analytics and store management together
Shop Explorer is worth considering if you want to review sales metrics and then move directly into product, order, or customer management without adopting a separate analytics service as your main workspace.
Choose WooCommerce Analytics for built in reporting
WooCommerce Analytics is a sensible starting point if you want standard sales reports within your existing WooCommerce installation. Its Products Report includes product level sales information and comparison functionality for evaluating product performance.
Consider Metorik for deeper reporting workflows
Metorik is positioned around a dedicated analytics service with extensive reporting, filtering, customer segmentation, and profit analysis. It may suit stores that need deeper reporting workflows and are comfortable with an external subscription.
Compare the reports you actually use, the amount of historical data you need, your store’s order volume, and the cost of maintaining each solution before deciding.
Common WooCommerce Analytics Mistakes
Confusing revenue with profit
Revenue does not account for every business expense. Include reliable cost information before drawing conclusions about profitability.
Comparing different reporting periods
Comparing a complete month with only part of another month can produce misleading conclusions. Use equivalent periods and check for seasonal differences.
Looking at order count without order value
More orders do not always mean more sales value. Review order count alongside revenue and average order value to understand what changed.
Assuming a chart explains the cause
Charts show patterns, but they rarely prove why a change occurred. Investigate products, promotions, inventory, refunds, and other relevant records before making a decision.
Ignoring data definitions
Different tools can calculate sales metrics differently. Read the definitions for refunds, discounts, taxes, shipping, and average order value before comparing dashboards.
Collecting data without taking action
The purpose of analytics is to improve decisions. Turn important findings into specific actions, such as reviewing a declining product, checking inventory, or testing a new promotion. Then measure what happens next.
Frequently Asked Questions
What is the best WooCommerce sales analytics dashboard?
The best dashboard depends on your reporting needs. WooCommerce Analytics provides built in sales reports, Shop Explorer combines analytics with store management tools, and Metorik offers a dedicated analytics service with extensive reports and segmentation.
Can I track WooCommerce revenue in WordPress?
Yes. WooCommerce provides built in analytics, and compatible plugins can offer additional dashboards. Shop Explorer includes an analytics dashboard that presents revenue and other store metrics within the WordPress admin experience.
How do I find my best selling WooCommerce products?
Open a product performance report and examine units sold, sales value, order count, and the reporting period. Consider stock availability and costs before deciding which products are most valuable to your business.
What is average order value in WooCommerce?
Average order value estimates the average value of orders during a selected period. The exact calculation depends on the report’s definition, so check whether it uses gross sales, net sales, or another measure before comparing results.
Does sales analytics show actual profit?
Not necessarily. Revenue reports describe sales activity, while profit analysis requires cost information such as product costs and relevant business expenses. The completeness of the cost data determines how useful a profit estimate will be.
Can AI analyze WooCommerce sales data?
Some tools provide AI assisted analysis using sales metrics and other store data. Shop Explorer’s documentation describes an AI revenue analysis workflow. Verify the available features and configured AI provider in your installation, and check AI suggestions against the underlying reports before acting on them.
Is Shop Explorer free?
Shop Explorer’s published core feature set is free. Review the official plugin listing for current feature availability and check whether any advanced functionality or external AI provider usage has separate requirements or costs.
Turn WooCommerce Sales Data Into Better Decisions
A useful analytics dashboard does more than display attractive charts. It helps you understand what changed, investigate the reasons, and decide what to do next.
Start by monitoring revenue, order count, average order value, and product performance. Compare consistent reporting periods, account for refunds and costs, and use the findings to guide practical improvements to your store.
If you want sales analytics alongside product editing, order management, and customer tools, explore Shop Explorer by WPAzleen. It brings important store management workflows into your WordPress dashboard.
Shop Explorer is developed by WPAzleen. WooCommerce is a trademark of its respective owner. Reporting definitions, product features, and plan availability should be verified against current official documentation.










Leave a Comment
Your email address will not be published. Required fields are marked *